| ⇦ | 
| ⇨ |
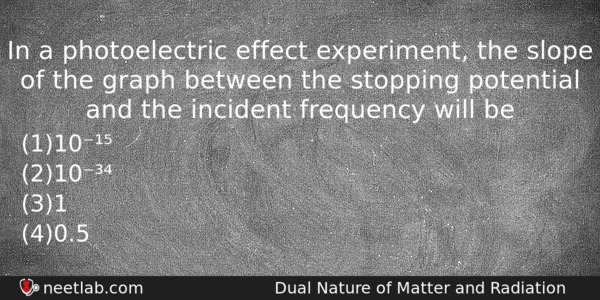
In a photoelectric effect experiment, the slope of the graph between the stopping potential and the incident frequency will be
Options
(a) 10⁻¹⁵
(b) 10⁻³⁴
(c) 1
(d) 0.5
Correct Answer:
10⁻¹⁵
Explanation:
No explanation available. Be the first to write the explanation for this question by commenting below.
Related Questions: - As a result of interference of two coherent sources of light, energy is
- Four blocks of same mass connected by cords are pulled by a force F
- An object is placed at a distance of 10 cm from a co-axial combination of two lenses
- A coil of resistance and 1.0 H inductance is connected to an a.c. source of frequency
- ₆C¹⁴ absorbs an energitic neutron and emits beta particles. The resulting nucleus is
Topics: Dual Nature of Matter and Radiation
(150)
Subject: Physics
(2479)
Important MCQs Based on Medical Entrance Examinations To Improve Your NEET Score
- As a result of interference of two coherent sources of light, energy is
- Four blocks of same mass connected by cords are pulled by a force F
- An object is placed at a distance of 10 cm from a co-axial combination of two lenses
- A coil of resistance and 1.0 H inductance is connected to an a.c. source of frequency
- ₆C¹⁴ absorbs an energitic neutron and emits beta particles. The resulting nucleus is
Topics: Dual Nature of Matter and Radiation (150)
Subject: Physics (2479)
Important MCQs Based on Medical Entrance Examinations To Improve Your NEET Score
18000+ students are using NEETLab to improve their score. What about you?
Solve Previous Year MCQs, Mock Tests, Topicwise Practice Tests, Identify Weak Topics, Formula Flash cards and much more is available in NEETLab Android App to improve your NEET score.
Share this page with your friends

Leave a Reply