| ⇦ | 
| ⇨ |
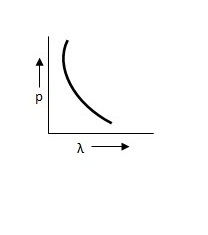
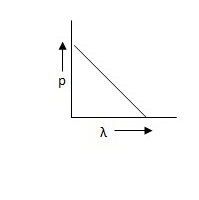
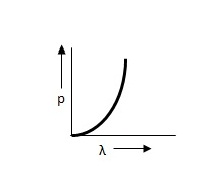
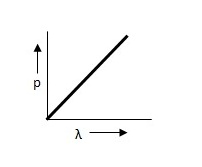
Which of the following figures represent the variation of particle momentum and the associated de-Broglie wavelength?
Options
(a)
(b)
(c)
(d)
Correct Answer:
(a)
Explanation:
The de-Broglie wavelength is given by λ = h / p
⇒ pλ = h
This equation is in the form of yx = c, which is the equation of a rectangular hyperbola
Related Questions: - In a common emitter transistor amplifier, the voltage gain is
- If v is the speed of sound in air, then the shortest length of the closed pipe
- Which one of the following equations of motion represents simple harmonic motion?
- To obtain a p-type semiconductor, germanium must be doped with
- An inductor 20 mH, a capacitor 50 μF and a resistor 40Ω are connected in series
Topics: Dual Nature of Matter and Radiation
(150)
Subject: Physics
(2479)
Important MCQs Based on Medical Entrance Examinations To Improve Your NEET Score
- In a common emitter transistor amplifier, the voltage gain is
- If v is the speed of sound in air, then the shortest length of the closed pipe
- Which one of the following equations of motion represents simple harmonic motion?
- To obtain a p-type semiconductor, germanium must be doped with
- An inductor 20 mH, a capacitor 50 μF and a resistor 40Ω are connected in series
Topics: Dual Nature of Matter and Radiation (150)
Subject: Physics (2479)
Important MCQs Based on Medical Entrance Examinations To Improve Your NEET Score
18000+ students are using NEETLab to improve their score. What about you?
Solve Previous Year MCQs, Mock Tests, Topicwise Practice Tests, Identify Weak Topics, Formula Flash cards and much more is available in NEETLab Android App to improve your NEET score.

Share this page with your friends
Leave a Reply