| ⇦ | 
| ⇨ |
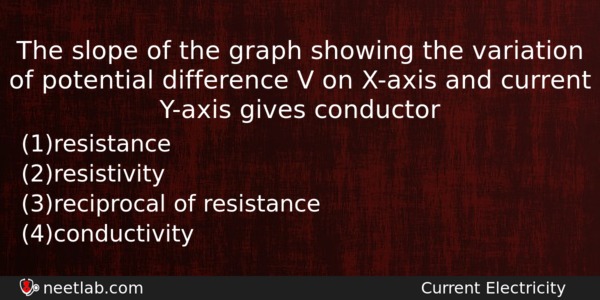
The slope of the graph showing the variation of potential difference V on X-axis and current Y-axis gives conductor
Options
(a) resistance
(b) resistivity
(c) reciprocal of resistance
(d) conductivity
Correct Answer:
reciprocal of resistance
Explanation:
No explanation available. Be the first to write the explanation for this question by commenting below.
Related Questions: - If two slits in Young’s experiment are 0.4 mm apart and fringe width on a screen
- Two points are located at a distance of 10 m and 15 m from the source of oscillation
- Hard X-rays for the study of fractures in bones should have a minimum wavelength
- In Moseley’s law √ν=a(z-b), the values of the screening constant for K-series
- At a metro station, a girl walks up a stationary escalator in time t₁
Topics: Current Electricity
(136)
Subject: Physics
(2479)
Important MCQs Based on Medical Entrance Examinations To Improve Your NEET Score
- If two slits in Young’s experiment are 0.4 mm apart and fringe width on a screen
- Two points are located at a distance of 10 m and 15 m from the source of oscillation
- Hard X-rays for the study of fractures in bones should have a minimum wavelength
- In Moseley’s law √ν=a(z-b), the values of the screening constant for K-series
- At a metro station, a girl walks up a stationary escalator in time t₁
Topics: Current Electricity (136)
Subject: Physics (2479)
Important MCQs Based on Medical Entrance Examinations To Improve Your NEET Score
18000+ students are using NEETLab to improve their score. What about you?
Solve Previous Year MCQs, Mock Tests, Topicwise Practice Tests, Identify Weak Topics, Formula Flash cards and much more is available in NEETLab Android App to improve your NEET score.

Share this page with your friends
Slope= tany/tanx
=I/V
=1/R ( V=IR)
Which is reciprocal of resistance