| ⇦ | 
| ⇨ |
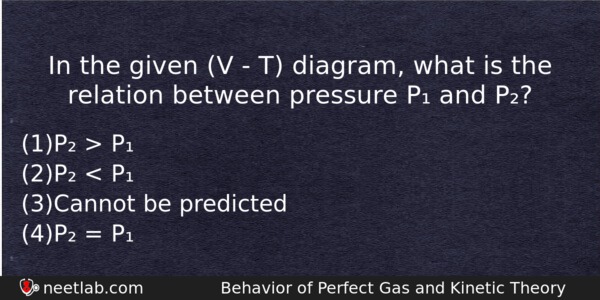
In the given (V – T) diagram, what is the relation between pressure P₁ and P₂?
Options
(a) P₂ > P₁
(b) P₂ < P₁
(c) Cannot be predicted
(d) P₂ = P₁
Correct Answer:
P₂ < P₁
Explanation:
P₂ < P₁ As V = constant ⇒ P ∝ T Hence from V-T graph P₂ < P₁.
Related Questions: - A body of mass 2 kg travels according to the law x(t)=pt+qt²+rt³
- On observing light from three different stars P, Q and R, it was found that intensity
- The radius of gyration of a solid sphere of radius r about a certain axis is r
- Which scientist experimentally proved the existence of electromagnetic waves?
- Four indentical thin rods each of mass M and length l, form a square frame
Topics: Behavior of Perfect Gas and Kinetic Theory
(34)
Subject: Physics
(2479)
Important MCQs Based on Medical Entrance Examinations To Improve Your NEET Score
- A body of mass 2 kg travels according to the law x(t)=pt+qt²+rt³
- On observing light from three different stars P, Q and R, it was found that intensity
- The radius of gyration of a solid sphere of radius r about a certain axis is r
- Which scientist experimentally proved the existence of electromagnetic waves?
- Four indentical thin rods each of mass M and length l, form a square frame
Topics: Behavior of Perfect Gas and Kinetic Theory (34)
Subject: Physics (2479)
Important MCQs Based on Medical Entrance Examinations To Improve Your NEET Score
18000+ students are using NEETLab to improve their score. What about you?
Solve Previous Year MCQs, Mock Tests, Topicwise Practice Tests, Identify Weak Topics, Formula Flash cards and much more is available in NEETLab Android App to improve your NEET score.
Share this page with your friends

Leave a Reply