| ⇦ | 
| ⇨ |
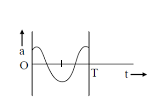
The oscillation of a body on a smooth horizontal surface is represented by the equation,
X=A cos(ωt)
where, X=displacement at time t
ω= frequency of oscillation
Which one of the following graphs shows correctly the variation a with t?
Options
(a)
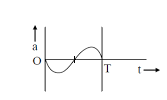
(b)
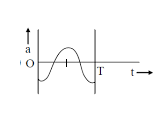
(c)
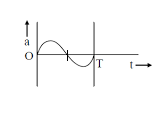
(d)
Correct Answer:
Explanation:
No explanation available. Be the first to write the explanation for this question by commenting below.
Related Questions: - The flux linked with a circuit is given by φ=t³+3t-7. The graph between time
- A block of mass 0.50 kg is moving with a speed of 2.00 ms⁻¹ on a smooth surface.
- Aperture of human eye is 0.2 cm. The minimum magnifying power of a visual
- A spherical drop of capacitance 1μF is broken into eight drops of equal radius.
- A planar coil having 12 turns carries 15 A current. The coil is oriented with respect
Topics: Oscillations
(58)
Subject: Physics
(2479)
Important MCQs Based on Medical Entrance Examinations To Improve Your NEET Score
- The flux linked with a circuit is given by φ=t³+3t-7. The graph between time
- A block of mass 0.50 kg is moving with a speed of 2.00 ms⁻¹ on a smooth surface.
- Aperture of human eye is 0.2 cm. The minimum magnifying power of a visual
- A spherical drop of capacitance 1μF is broken into eight drops of equal radius.
- A planar coil having 12 turns carries 15 A current. The coil is oriented with respect
Topics: Oscillations (58)
Subject: Physics (2479)
Important MCQs Based on Medical Entrance Examinations To Improve Your NEET Score
18000+ students are using NEETLab to improve their score. What about you?
Solve Previous Year MCQs, Mock Tests, Topicwise Practice Tests, Identify Weak Topics, Formula Flash cards and much more is available in NEETLab Android App to improve your NEET score.

Share this page with your friends
Leave a Reply