| ⇦ | 
| ⇨ |
The oscillation of a body on a smooth horizontal surface is represented by the equation,
X=A cos(ωt)
where, X=displacement at time t
ω= frequency of oscillation
Which one of the following graphs shows correctly the variation a with t?
Options
(a)
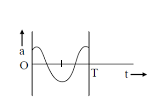
(b)
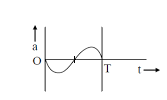
(c)
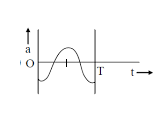
(d)
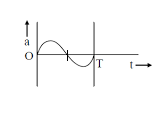
Correct Answer:
Explanation:
No explanation available. Be the first to write the explanation for this question by commenting below.
Related Questions: - Imagine a light planet revolving around a very massive star in a circular
- The ‘rad’ is the correct unit used to report the measurement of
- A galvanometer coil has a resistance of 15 ohm and gives full scale deflection
- The process of adding impurities to the pure semiconductor is called
- An air core solenoid has 1000 turns and is one meter long. Its cross sectional area
Topics: Oscillations
(58)
Subject: Physics
(2479)
Important MCQs Based on Medical Entrance Examinations To Improve Your NEET Score
- Imagine a light planet revolving around a very massive star in a circular
- The ‘rad’ is the correct unit used to report the measurement of
- A galvanometer coil has a resistance of 15 ohm and gives full scale deflection
- The process of adding impurities to the pure semiconductor is called
- An air core solenoid has 1000 turns and is one meter long. Its cross sectional area
Topics: Oscillations (58)
Subject: Physics (2479)
Important MCQs Based on Medical Entrance Examinations To Improve Your NEET Score
18000+ students are using NEETLab to improve their score. What about you?
Solve Previous Year MCQs, Mock Tests, Topicwise Practice Tests, Identify Weak Topics, Formula Flash cards and much more is available in NEETLab Android App to improve your NEET score.

Share this page with your friends
Leave a Reply