| ⇦ | 
| ⇨ |
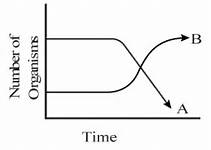
The following graph depicts changes in two populations (A and B) of herbivores in a grassy field A, possible reason for these changes is that:
Options
(a) Population B competed more successfully for food than population A
(b) Population A produced more offspring than population B
(c) Population A consumed the members of population B
(d) Both plant populations in this habitat decreased
Correct Answer:
Population B competed more successfully for food than population A
Explanation:
No explanation available. Be the first to write the explanation for this question by commenting below.
Related Questions: - Which of the following characteristics represent Inheritance of blood groups
- A vascular bundle having phloem on either side of the xylem
- Which one of the following growth regulators is known as stress hormone?
- The leaf less stem of onion,which is produced to bear flower is called
- Food poisoning is due to
Topics: Populations and Ecosystem
(125)
Subject: Biology
(4253)
Important MCQs Based on Medical Entrance Examinations To Improve Your NEET Score
- Which of the following characteristics represent Inheritance of blood groups
- A vascular bundle having phloem on either side of the xylem
- Which one of the following growth regulators is known as stress hormone?
- The leaf less stem of onion,which is produced to bear flower is called
- Food poisoning is due to
Topics: Populations and Ecosystem (125)
Subject: Biology (4253)
Important MCQs Based on Medical Entrance Examinations To Improve Your NEET Score
18000+ students are using NEETLab to improve their score. What about you?
Solve Previous Year MCQs, Mock Tests, Topicwise Practice Tests, Identify Weak Topics, Formula Flash cards and much more is available in NEETLab Android App to improve your NEET score.

Share this page with your friends
Leave a Reply