| ⇦ | 
| ⇨ |
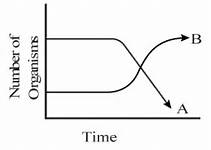
The following graph depicts changes in two populations (A and B) of herbivores in a grassy field A, possible reason for these changes is that:
Options
(a) Population B competed more successfully for food than population A
(b) Population A produced more offspring than population B
(c) Population A consumed the members of population B
(d) Both plant populations in this habitat decreased
Correct Answer:
Population B competed more successfully for food than population A
Explanation:
No explanation available. Be the first to write the explanation for this question by commenting below.
Related Questions: - Which one of the following help in absorption of phosphorus from soil by plants?
- Fovea in the eye is a central pit in the yellowish pigmented spot called
- A gene that specifies amino acid sequence of a polypeptide chain is termed as
- The cell as a basic unit of structure of living things was discovered by
- Pure line breed refers to
Topics: Populations and Ecosystem
(125)
Subject: Biology
(4253)
Important MCQs Based on Medical Entrance Examinations To Improve Your NEET Score
- Which one of the following help in absorption of phosphorus from soil by plants?
- Fovea in the eye is a central pit in the yellowish pigmented spot called
- A gene that specifies amino acid sequence of a polypeptide chain is termed as
- The cell as a basic unit of structure of living things was discovered by
- Pure line breed refers to
Topics: Populations and Ecosystem (125)
Subject: Biology (4253)
Important MCQs Based on Medical Entrance Examinations To Improve Your NEET Score
18000+ students are using NEETLab to improve their score. What about you?
Solve Previous Year MCQs, Mock Tests, Topicwise Practice Tests, Identify Weak Topics, Formula Flash cards and much more is available in NEETLab Android App to improve your NEET score.

Share this page with your friends
Leave a Reply