| ⇦ | 
| ⇨ |
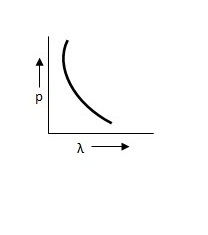
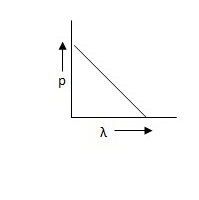
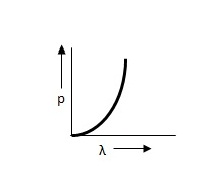
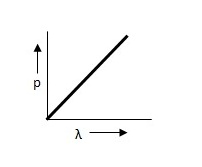
Which of the following figures represent the variation of particle momentum and the associated de-Broglie wavelength?
Options
(a)
(b)
(c)
(d)
Correct Answer:
(a)
Explanation:
The de-Broglie wavelength is given by λ = h / p
⇒ pλ = h
This equation is in the form of yx = c, which is the equation of a rectangular hyperbola
Related Questions: - Photoelectric current from a given photocell will depend upon
- A man weighing 60 kg climbs a staircase carrying a 20 kg load on his hand
- If two vectors are equal in magnitude and their resultant is also equal in magnitude
- The amount of heat energy required to raise the temperature of 1 g of Helium
- A glass flask weighing 390 g having internal volume 500 cc just floats
Topics: Dual Nature of Matter and Radiation
(150)
Subject: Physics
(2479)
Important MCQs Based on Medical Entrance Examinations To Improve Your NEET Score
- Photoelectric current from a given photocell will depend upon
- A man weighing 60 kg climbs a staircase carrying a 20 kg load on his hand
- If two vectors are equal in magnitude and their resultant is also equal in magnitude
- The amount of heat energy required to raise the temperature of 1 g of Helium
- A glass flask weighing 390 g having internal volume 500 cc just floats
Topics: Dual Nature of Matter and Radiation (150)
Subject: Physics (2479)
Important MCQs Based on Medical Entrance Examinations To Improve Your NEET Score
18000+ students are using NEETLab to improve their score. What about you?
Solve Previous Year MCQs, Mock Tests, Topicwise Practice Tests, Identify Weak Topics, Formula Flash cards and much more is available in NEETLab Android App to improve your NEET score.

Share this page with your friends
Leave a Reply