| ⇦ | 
| ⇨ |
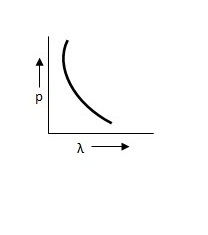
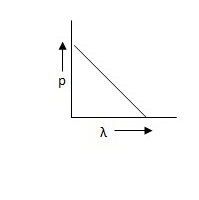
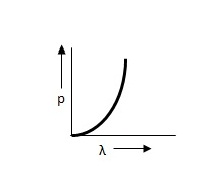
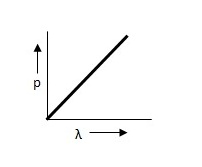
Which of the following figures represent the variation of particle momentum and the associated de-Broglie wavelength?
Options
(a)
(b)
(c)
(d)
Correct Answer:
(a)
Explanation:
The de-Broglie wavelength is given by λ = h / p
⇒ pλ = h
This equation is in the form of yx = c, which is the equation of a rectangular hyperbola
Related Questions: - A plank with a box on it at one end is gradually raised about the other end.
- Two racing cars of masses m₁ and m₂ are moving in circles of radii
- The escape velocity from the earth is Ve. The escape velocity from a planet
- A thin prism of angle 15⁰ made of glass of refractive index µ₁ = 1.5 is combined
- A heavy stone hanging from a massless string of length 15 m is projected
Topics: Dual Nature of Matter and Radiation
(150)
Subject: Physics
(2479)
Important MCQs Based on Medical Entrance Examinations To Improve Your NEET Score
- A plank with a box on it at one end is gradually raised about the other end.
- Two racing cars of masses m₁ and m₂ are moving in circles of radii
- The escape velocity from the earth is Ve. The escape velocity from a planet
- A thin prism of angle 15⁰ made of glass of refractive index µ₁ = 1.5 is combined
- A heavy stone hanging from a massless string of length 15 m is projected
Topics: Dual Nature of Matter and Radiation (150)
Subject: Physics (2479)
Important MCQs Based on Medical Entrance Examinations To Improve Your NEET Score
18000+ students are using NEETLab to improve their score. What about you?
Solve Previous Year MCQs, Mock Tests, Topicwise Practice Tests, Identify Weak Topics, Formula Flash cards and much more is available in NEETLab Android App to improve your NEET score.

Share this page with your friends
Leave a Reply